Representações Celulares com Quadtrees: Exercício de Modelagem Geométrica
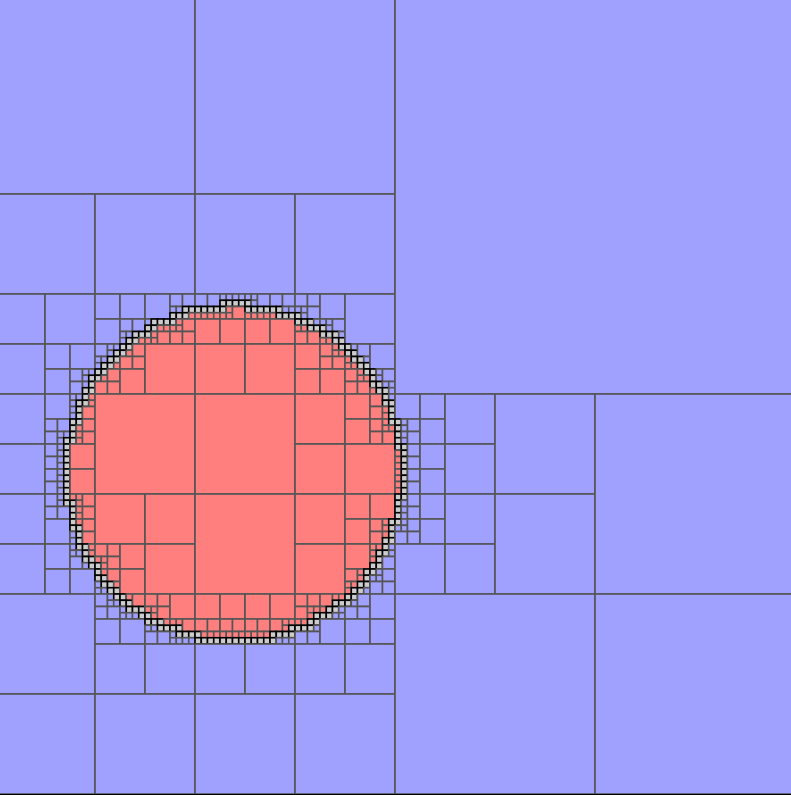
Contexto
Este post documenta a solução de um exercício da disciplina de verão Temas de Computação Visual - 2026 do IMPA, especificamente sobre Modelagem Geométrica. O objetivo é calcular representações celulares uniformes e adaptativas de regiões do plano usando a técnica de subdivisão espacial conhecida como quadtree.
O Problema
O exercício propõe dois desafios principais de classificação de regiões:
Problema 1: Disco em Região Retangular
Calcular representações celulares uniformes e adaptativas de um disco dentro do quadrado unitário $[0, 1] \times [0, 1]$.
Parâmetros de referência do Disco:
- Centro: $(0.3, 0.4)$
- Raio: $0.21$
Problema 2: Região Parabólica
Calcular representações celulares uniformes e adaptativas para a região do plano dada por:
\[y \geq x^2 + c\]na área retangular $[-2, 2] \times [-2, 2]$.
Parâmetro de referência: $c = 0$
Fundamentação Teórica
Quadtrees e Subdivisão Espacial
Uma quadtree é uma estrutura hierárquica que particiona recursivamente o espaço bidimensional em quatro quadrantes. No contexto de modelagem geométrica, usamos essa estrutura para criar representações celulares que aproximam regiões definidas por curvas ou formas geométricas.
Classificação de Células
Cada célula retangular da subdivisão pode ser classificada em três categorias:
- DENTRO: a célula está completamente contida na região de interesse
- FORA: a célula está completamente externa à região
- MISTO: a fronteira da região atravessa a célula
Modos de Subdivisão
Subdivisão Uniforme: todas as células são subdivididas até um nível fixo $n$, gerando $4^n$ células no nível mais refinado.
Subdivisão Adaptativa: células classificadas como DENTRO ou FORA não são mais subdivididas, economizando memória e processamento. Apenas células MISTO continuam sendo refinadas.
Solução Implementada
1. Classificação do Disco
O desafio técnico aqui é determinar a distância mínima entre um retângulo (a célula) e o centro do círculo $C = (c_x, c_y)$. Para isso, definimos o ponto $P_{closest} = (x_{closest}, y_{closest})$ como o ponto pertencente ao retângulo que está “mais perto de colidir” com o centro do círculo.
As coordenadas de $P_{closest}$ são calculadas pelas seguintes condicionais:
\[x_{closest} = \begin{cases} x_{min} & \text{se } c_x < x_{min} \text{ (centro à esquerda)} \\ c_x & \text{se } x_{min} \le c_x \le x_{max} \text{ (centro alinhado horizontalmente)} \\ x_{max} & \text{se } c_x > x_{max} \text{ (centro à direita)} \end{cases}\]Analogamente para o eixo Y:
\[y_{closest} = \begin{cases} y_{min} & \text{se } c_y < y_{min} \\ c_y & \text{se } y_{min} \le c_y \le y_{max} \\ y_{max} & \text{se } c_y > y_{max} \end{cases}\]Critérios de Decisão:
Teste FORA: Se a distância euclidiana entre $P_{closest}$ e o centro do círculo for maior que o raio $r$, a célula está garantidamente fora: \((x_{closest} - c_x)^2 + (y_{closest} - c_y)^2 > r^2\)
Teste DENTRO: Se os quatro vértices do retângulo estiverem dentro do círculo (distância ao centro $\le r$), a célula está totalmente contida.
Teste MISTO: Se não for totalmente “fora” nem totalmente “dentro”, a célula é marcada como mista e deve ser subdividida.
Estrutura do Código
Implementei um programa em C++ que gera visualizações SVG progressivas da subdivisão:
1. Programa para o Disco
Estrutura de dados:
1
2
struct Circulo { double cx, cy, r; };
enum Classificacao { FORA, DENTRO, MISTO };
1
2
3
4
5
6
7
8
9
10
11
12
13
14
15
16
17
18
19
Classificacao classificar(double xmin, double xmax, double ymin, double ymax, Circulo c)
{
    // Ponto mais próximo do círculo dentro do retângulo
    double closestX = std::max(xmin, std::min(c.cx, xmax));
    double closestY = std::max(ymin, std::min(c.cy, ymax));
    double distSq = (closestX - c.cx)*(closestX - c.cx) +
                    (closestY - c.cy)*(closestY - c.cy);

    if (distSq > c.r * c.r) return FORA;

    // Testa os 4 vértices
    bool tl = ((xmin - c.cx)*(xmin - c.cx) + (ymax - c.cy)*(ymax - c.cy)) <= c.r*c.r;
    bool tr = ((xmax - c.cx)*(xmax - c.cx) + (ymax - c.cy)*(ymax - c.cy)) <= c.r*c.r;
    bool bl = ((xmin - c.cx)*(xmin - c.cx) + (ymin - c.cy)*(ymin - c.cy)) <= c.r*c.r;
    bool br = ((xmax - c.cx)*(xmax - c.cx) + (ymin - c.cy)*(ymin - c.cy)) <= c.r*c.r;

    if (tl && tr && bl && br) return DENTRO;
    return MISTO;
}
2. Classificação da Parábola
Classificação para a região parabólica \(y ≥ x²+c\)
Para classificar as células em relação à parábola, utilizamos uma abordagem baseada em funções implícitas e análise de intervalos, o que garante precisão sem a necessidade de amostragens densas de pontos.
1. Definição da função implícita
Definimos a função: \(f(x,y)= y−(x²+c)\)
Um ponto \((x,y)\) está na região se \(f(x,y)≥0\). Portanto, a classificação de uma célula retangular \([xmin,xmax]×[ymin,ymax]\) pode ser feita estudando os valores extremos (mínimo e máximo) de \(f\) sobre o retângulo.
2. Estratégia (intuição)
Se o maior valor possível de $f$ no retângulo for negativo \((f_{max}<0)\), então nenhum ponto da célula pode estar na região → FORA.
Se o menor valor possível de f no retângulo for não-negativo \((f_{min}>=0)\), então todos os pontos da célula estão na região → DENTRO.
Caso contrário, a célula contém tanto pontos que satisfazem a condição quanto pontos que não satisfazem → MISTO (a fronteira cruza a célula).
3. Cálculo dos extremos
A função \(f(x,y)=y−x^2−c\) tem dependências separadas: ela cresce linearmente com \(y\) e decresce com o quadrado de \(x\).
Máximo de \(f\) no retângulo: Para maximizar \(f\), devemos escolher o maior \(y\) possível e o \(x²\) que resulte no menor valor.
Escolhemos \(y=y_{max}\).
Para minimizar \(x²\) no intervalo \([xmin,xmax]\), escolhemos o \(x\) mais próximo de 0.
Seja \(x_0=clamp(0,x_{min},x_{max})\). O valor máximo é:
\[f_{max}=y_{max}−(x_0²+c)\]
Mínimo de \(f\) no retângulo: Para minimizar \(f\), devemos escolher o menor \(y\) possível e o \(x²\) que resulte no maior valor.
Escolhemos \(y=y_{min}\).
Para maximizar \(x²\), olhamos para as extremidades do intervalo em \(x\), já que \(x²\) cresce com a distância da origem.
O valor mínimo é:
\[f_{min}=min({y_{min}−(x_{min}^2+c),y_{min}−(x_{max}^2+c)})\]
Estrutura do Código
Implementei um programa em C++ que gera visualizações SVG progressivas da subdivisão:
1. Programa para a Parabola
Estrutura de dados:
1
2
struct Parabola { double c; };
enum Classificacao { FORA, DENTRO, MISTO };
1
2
3
4
5
6
7
8
9
10
11
12
13
14
15
16
17
Classificacao classificar(double xmin, double xmax, double ymin, double ymax, Parabola p)
{
    double max_x2 = std::max(xmin * xmin, xmax * xmax);

    double min_x2;

    if (xmin <= 0 && xmax >= 0) min_x2 = 0.0;
    else min_x2 = std::min(xmin * xmin, xmax * xmax);


    if (ymin >= max_x2 + p.c) return DENTRO;

    if (ymax < min_x2 + p.c) return FORA;

    return MISTO;

}
Subdivisão Recursiva
Ambos os programas implementam a subdivisão recursiva:
1
2
3
4
5
6
7
8
9
10
11
12
13
14
15
16
17
18
19
20
21
22
23
24
25
26
void explore(std::ofstream& svg, double xmin, double xmax, double ymin, double ymax,
             int currentLevel, int targetLevel, /* ... */)
{
    Classificacao cl = classificar(xmin, xmax, ymin, ymax, /* ... */);

    // Modo adaptativo: para em células homogêneas
    if (!uniforme && cl != MISTO) {
        desenharSvgRect(svg, xmin, xmax, ymin, ymax, cl);
        return;
    }

    // Chegou no nível máximo
    if (currentLevel == targetLevel) {
        desenharSvgRect(svg, xmin, xmax, ymin, ymax, cl);
        return;
    }

    // Subdivide em 4 quadrantes
    double xmid = (xmin + xmax) / 2.0;
    double ymid = (ymin + ymax) / 2.0;

    explore(svg, xmin, xmid, ymin, ymid, currentLevel + 1, targetLevel, /* ... */);
    explore(svg, xmid, xmax, ymin, ymid, currentLevel + 1, targetLevel, /* ... */);
    explore(svg, xmin, xmid, ymid, ymax, currentLevel + 1, targetLevel, /* ... */);
    explore(svg, xmid, xmax, ymid, ymax, currentLevel + 1, targetLevel, /* ... */);
}
Visualização
Os programas geram arquivos SVG com o seguinte esquema de cores:
- Vermelho (
#ff7f7f): células DENTRO da região - Azul (
#a0a0ff): células FORA da região - Contorno preto: células MISTO (modo adaptativo)
- Cinza: células MISTO no nível máximo (quando não pode mais refinar)
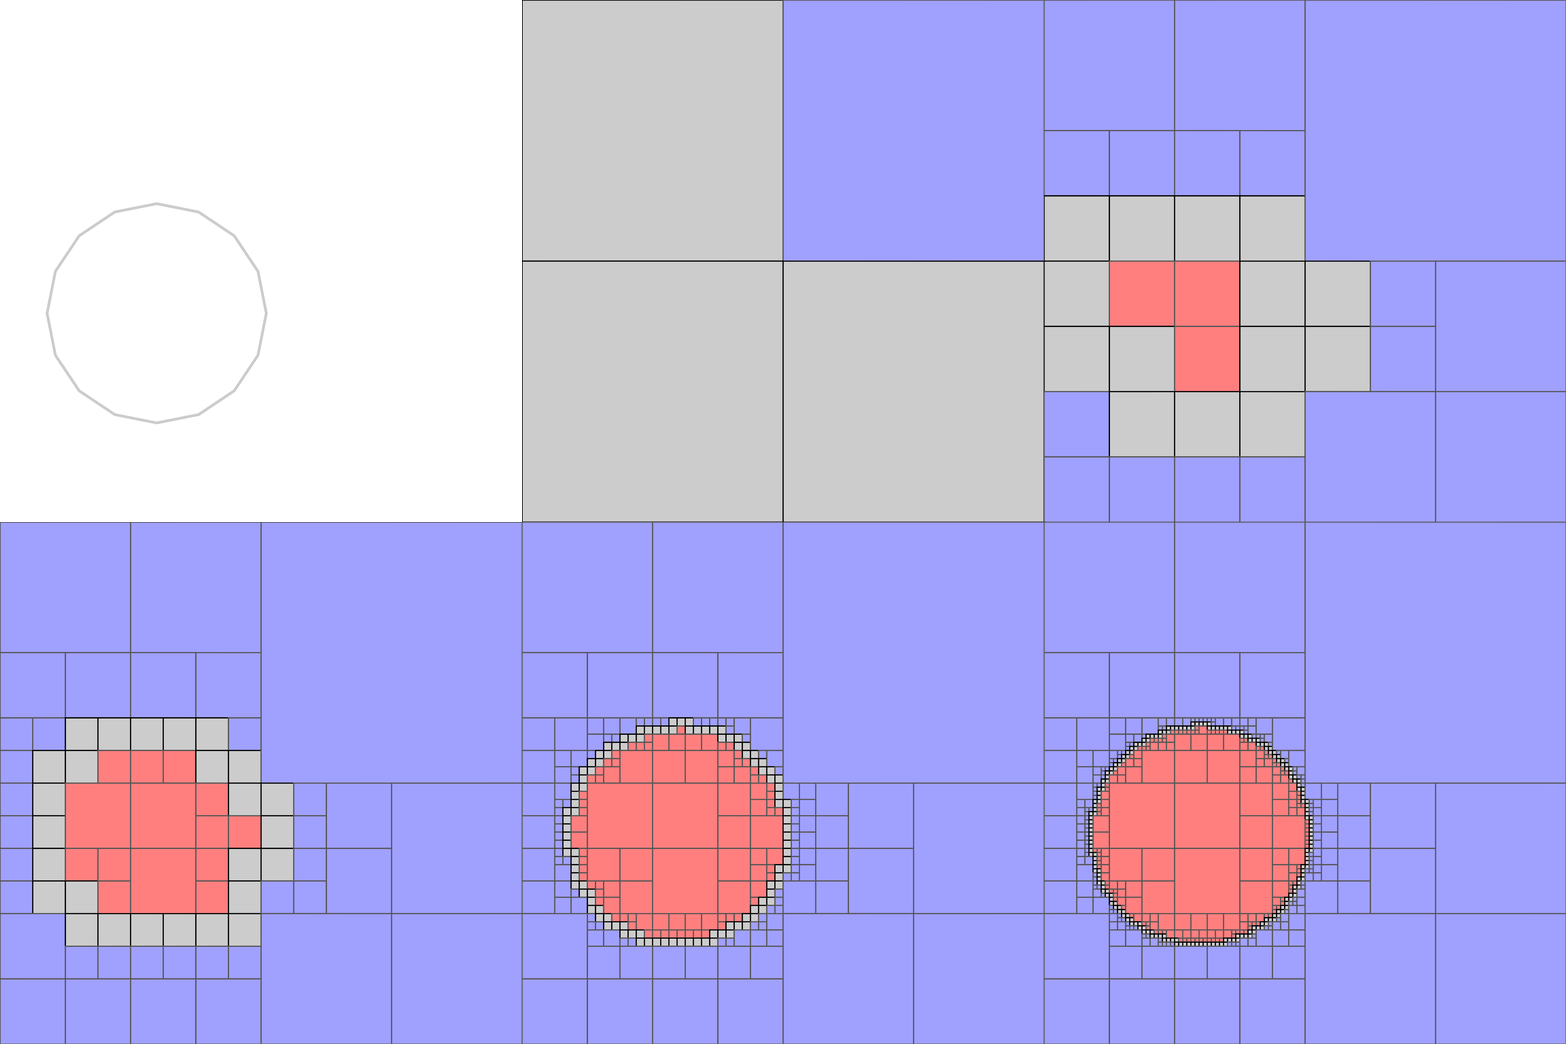 Disco com abordagem adaptativa
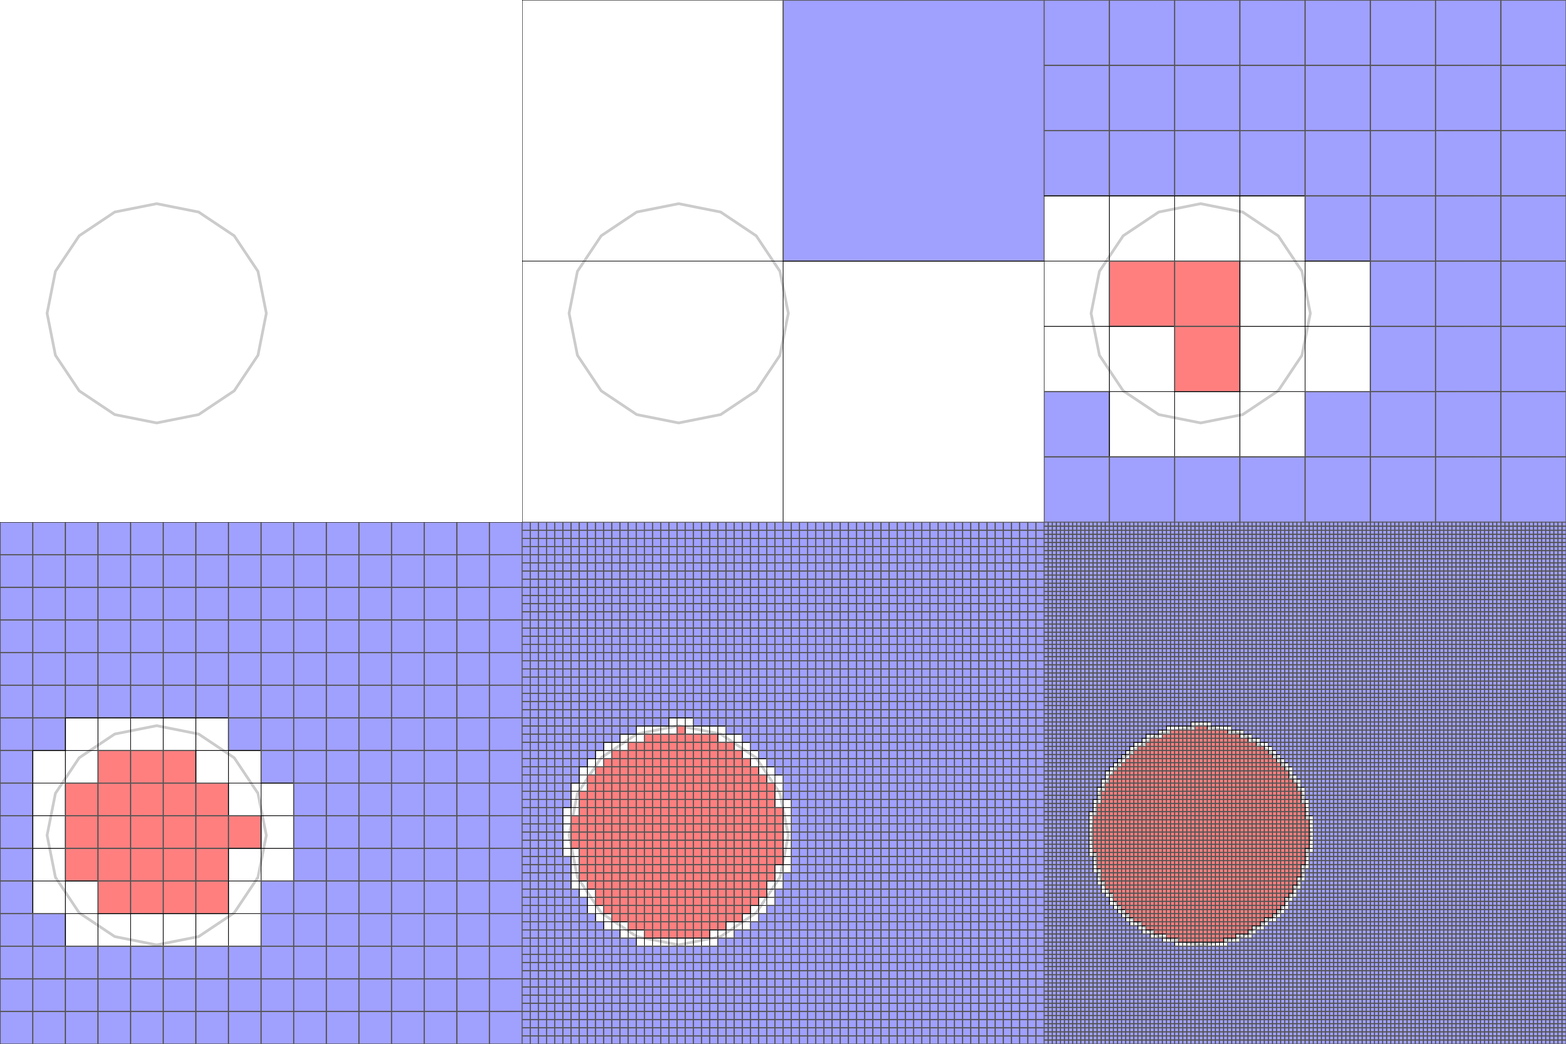 Disco com abordagem uniforme
 Parabóla com abordagem adaptativa
 Parabóla com abordagem uniforme
Complexidade Computacional
Subdivisão Uniforme (nível $n$):
- Número de células: $4^n$
- Complexidade espacial: $O(4^n)$
- Todas as células têm o mesmo tamanho
Subdivisão Adaptativa:
- Número de células: depende da geometria
- Complexidade: $O(k)$ onde $k$ é o número de células MISTO
- Células variam de tamanho conforme a proximidade da fronteira
Código Completo
Círculo
1
2
3
4
5
6
7
8
9
10
11
12
13
14
15
16
17
18
19
20
21
22
23
24
25
26
27
28
29
30
31
32
33
34
35
36
37
38
39
40
41
42
43
44
45
46
47
48
49
50
51
52
53
54
55
56
57
58
59
60
61
62
63
64
65
66
67
68
69
70
71
72
73
74
75
76
77
78
79
80
81
82
83
84
85
86
87
88
89
90
91
92
93
94
95
96
97
98
99
100
101
102
103
104
105
106
107
108
109
110
111
112
113
114
115
116
117
118
119
120
121
122
123
124
125
126
127
128
129
130
131
132
133
134
135
136
137
138
139
140
#include <iostream>
#include <fstream>
#include <string>
#include <cmath>
#include <algorithm>
#include <sstream>

enum Classificacao { FORA, DENTRO, MISTO };

struct Circulo { double cx, cy, r; };

Classificacao classificar(double xmin, double xmax, double ymin, double ymax, Circulo c)
{
    double closestX = std::max(xmin, std::min(c.cx, xmax));
    double closestY = std::max(ymin, std::min(c.cy, ymax));
    double distSq = (closestX - c.cx)*(closestX - c.cx) + (closestY - c.cy)*(closestY - c.cy);

    if (distSq > c.r * c.r) return FORA;

    bool tl = ((xmin - c.cx)*(xmin - c.cx) + (ymax - c.cy)*(ymax - c.cy)) <= c.r*c.r; // Testa se cada um dos pontos do retangulo está dentro da circ
    bool tr = ((xmax - c.cx)*(xmax - c.cx) + (ymax - c.cy)*(ymax - c.cy)) <= c.r*c.r;
    bool bl = ((xmin - c.cx)*(xmin - c.cx) + (ymin - c.cy)*(ymin - c.cy)) <= c.r*c.r;
    bool br = ((xmax - c.cx)*(xmax - c.cx) + (ymin - c.cy)*(ymin - c.cy)) <= c.r*c.r;

    if (tl && tr && bl && br) return DENTRO;
    return MISTO;
}

void desenharSvgRect(std::ofstream& svg, double xmin, double xmax, double ymin, double ymax, Classificacao c)
{
    std::string corFill, corStroke = "#555555";
    double strokeWidth = 0.002;

    switch (c)
        {
        case DENTRO: corFill = "#ff7f7f"; break;
        case FORA:   corFill = "#a0a0ff"; break;
        default:     corFill = "none"; break;
    }

    if (c == MISTO) {
         svg << "<rect x=\"" << xmin << "\" y=\"" << ymin
             << "\" width=\"" << xmax-xmin << "\" height=\"" << ymax-ymin
             << "\" fill=\"none\" stroke=\"black\" stroke-width=\"" << strokeWidth/2.0 << "\"/>\n";
    } else {
         svg << "<rect x=\"" << xmin << "\" y=\"" << ymin
             << "\" width=\"" << xmax-xmin << "\" height=\"" << ymax-ymin
             << "\" fill=\"" << corFill
             << "\" stroke=\"" << corStroke << "\" stroke-width=\"" << strokeWidth << "\"/>\n";
    }
}


void exploreUniforme(std::ofstream& svg, double xmin, double xmax, double ymin, double ymax, int currentLevel, int targetLevel, Circulo c)
{
    if (currentLevel == targetLevel)
    {

        Classificacao cl = classificar(xmin, xmax, ymin, ymax, c);

        desenharSvgRect(svg, xmin, xmax, ymin, ymax, cl);
        return;
    }


    double xmid = (xmin + xmax) / 2.0;
    double ymid = (ymin + ymax) / 2.0;

    exploreUniforme(svg, xmin, xmid, ymin, ymid, currentLevel + 1, targetLevel, c);
    exploreUniforme(svg, xmid, xmax, ymin, ymid, currentLevel + 1, targetLevel, c);
    exploreUniforme(svg, xmin, xmid, ymid, ymax, currentLevel + 1, targetLevel, c);
    exploreUniforme(svg, xmid, xmax, ymid, ymax, currentLevel + 1, targetLevel, c);
}

void explore(std::ofstream& svg, double xmin, double xmax, double ymin, double ymax, int currentLevel, int targetLevel, Circulo c)
{
    Classificacao cl = classificar(xmin, xmax, ymin, ymax, c);

    if (cl != MISTO) {
        desenharSvgRect(svg, xmin, xmax, ymin, ymax, cl);
        return;
    }


    if (currentLevel == targetLevel)
    {
        svg << "<rect x=\"" << xmin << "\" y=\"" << ymin
            << "\" width=\"" << xmax-xmin << "\" height=\"" << ymax-ymin
            << "\" fill=\"#cccccc\" stroke=\"black\" stroke-width=\"0.002\"/>\n";
        return;
    }

    double xmid = (xmin + xmax) / 2.0;
    double ymid = (ymin + ymax) / 2.0;

    explore(svg, xmin, xmid, ymin, ymid, currentLevel + 1, targetLevel, c);
    explore(svg, xmid, xmax, ymin, ymid, currentLevel + 1, targetLevel, c);
    explore(svg, xmin, xmid, ymid, ymax, currentLevel + 1, targetLevel, c);
    explore(svg, xmid, xmax, ymid, ymax, currentLevel + 1, targetLevel, c);
}

int main() {
    double mundoSize = 1.0;
    double imageSizePixels = 800.0;
    Circulo meuCirculo = {0.3, 0.6, 0.21}; // coordenada y invertida
    int maxNiveis = 7;


    for (int i = 0; i <= maxNiveis; i++)
    {

        std::stringstream ss;
        ss << "quadtree_passo_" << i << ".svg";
        std::string nomeArquivo = ss.str();

        std::ofstream svg;
        svg.open(nomeArquivo);

         svg << "<svg width=\"" << imageSizePixels << "\" height=\"" << imageSizePixels
            << "\" viewBox=\"0 0 " << mundoSize << " " << mundoSize
            << "\" xmlns=\"http://www.w3.org/2000/svg\">\n";

        svg << "<rect width=\"100%\" height=\"100%\" fill=\"white\"/>\n";

        svg << "<circle cx=\"" << meuCirculo.cx << "\" cy=\"" << meuCirculo.cy
            << "\" r=\"" << meuCirculo.r << "\" fill=\"none\" stroke=\"#00000033\" stroke-width=\"0.005\"/>\n";

        exploreUniforme(svg, 0, mundoSize, 0, mundoSize, 0, i, meuCirculo);

        svg << "</svg>";
        svg.close();

        std::cout << "Gerado: " << nomeArquivo << " (Nivel " << i << ")\n";
    }

    return 0;
}
Parabóla
1
2
3
4
5
6
7
8
9
10
11
12
13
14
15
16
17
18
19
20
21
22
23
24
25
26
27
28
29
30
31
32
33
34
35
36
37
38
39
40
41
42
43
44
45
46
47
48
49
50
51
52
53
54
55
56
57
58
59
60
61
62
63
64
65
66
67
68
69
70
71
72
73
74
75
76
77
78
79
80
81
82
83
84
85
86
87
88
89
90
91
92
93
94
95
96
97
98
99
100
101
102
103
104
105
106
107
108
109
110
111
112
113
114
115
116
117
118
119
120
121
122
123
124
125
126
#include <iostream>
#include <fstream>
#include <string>
#include <cmath>
#include <algorithm>
#include <sstream>

enum Classificacao { FORA, DENTRO, MISTO };

struct Parabola { double c; };

Classificacao classificar(double xmin, double xmax, double ymin, double ymax, Parabola p)
{
    double max_x2 = std::max(xmin * xmin, xmax * xmax);

    double min_x2;

    if (xmin <= 0 && xmax >= 0) min_x2 = 0.0;
    else min_x2 = std::min(xmin * xmin, xmax * xmax);


    if (ymin >= max_x2 + p.c) return DENTRO;

    if (ymax < min_x2 + p.c) return FORA;

    return MISTO;
}

void desenharSvgRect(std::ofstream& svg, double xmin, double xmax, double ymin, double ymax, Classificacao c)
{
    std::string corFill, corStroke;
    double strokeWidth = 0.002;

    switch (c)
    {
        case DENTRO:
            corFill = "#ff7f7f";
            corStroke = "#e57272";
            break;
        case FORA:
            corFill = "#a0a0ff";
            corStroke = "#9090e5";
            break;
        case MISTO:
            corFill = "none";
            corStroke = "#cccccc";
            break;
    }

    svg << "<rect x=\"" << xmin << "\" y=\"" << ymin
        << "\" width=\"" << xmax - xmin << "\" height=\"" << ymax - ymin
        << "\" fill=\"" << corFill
        << "\" stroke=\"" << corStroke
        << "\" stroke-width=\"" << strokeWidth << "\"/>\n";
}

void explore(std::ofstream& svg, double xmin, double xmax, double ymin, double ymax,
             int currentLevel, int targetLevel, Parabola p, bool uniforme)
{
    Classificacao cl = classificar(xmin, xmax, ymin, ymax, p);

    if (!uniforme && cl != MISTO) {
        desenharSvgRect(svg, xmin, xmax, ymin, ymax, cl);
        return;
    }

    if (currentLevel == targetLevel)
    {
        if (uniforme)
            desenharSvgRect(svg, xmin, xmax, ymin, ymax, cl);
        else
            desenharSvgRect(svg, xmin, xmax, ymin, ymax, cl);

        return;
    }

    double xmid = (xmin + xmax) / 2.0;
    double ymid = (ymin + ymax) / 2.0;

    explore(svg, xmin, xmid, ymin, ymid, currentLevel + 1, targetLevel, p, uniforme);
    explore(svg, xmid, xmax, ymin, ymid, currentLevel + 1, targetLevel, p, uniforme);
    explore(svg, xmin, xmid, ymid, ymax, currentLevel + 1, targetLevel, p, uniforme);
    explore(svg, xmid, xmax, ymid, ymax, currentLevel + 1, targetLevel, p, uniforme);
}

int main() {
    double xMinMundo = -2.0, xMaxMundo = 2.0;
    double yMinMundo = -2.0, yMaxMundo = 2.0;
    double widthMundo = xMaxMundo - xMinMundo;
    double heightMundo = yMaxMundo - yMinMundo;
    double pixelsize = 800.0;

    Parabola minhaParabola = { -1.0 };
    int maxNiveis = 7;

    for (int tipo = 0; tipo < 2; tipo++)
    {
        bool modoUniforme = (tipo == 0);
        std::string tipoStr = modoUniforme ? "uniforme" : "adaptativo";

        for (int nivel = 0; nivel <= maxNiveis; nivel++)
        {
            std::stringstream ss;
            ss << "parabola_" << tipoStr << "_nivel_" << nivel << ".svg";
            std::string nomeArquivo = ss.str();

            std::ofstream svg;
            svg.open(nomeArquivo);

            svg << "<svg width=\"" << pixelsize << "\" height=\"" << pixelsize
                << "\" viewBox=\"" << xMinMundo << " " << yMinMundo << " " << widthMundo << " " << heightMundo
                << "\" xmlns=\"http://www.w3.org/2000/svg\">\n";

            svg << "<rect x=\"" << xMinMundo << "\" y=\"" << yMinMundo
                << "\" width=\"" << widthMundo << "\" height=\"" << heightMundo << "\" fill=\"white\"/>\n";

            explore(svg, xMinMundo, xMaxMundo, yMinMundo, yMaxMundo, 0, nivel, minhaParabola, modoUniforme);

            svg << "</svg>";
            svg.close();

        }
    }

    return 0;
}